
The Illusion of Average Returns: How Sequence and Volatility Shape the Path to Wealth
The Illusion of Average Returns: How Sequence and Volatility Shape the Path to Wealth
An 8.4% average annual return is perhaps the most comforting statistic in wealth management and the most dangerously misleading. While this historical figure suggests a smooth, predictable path to wealth, implying that capital grows reliably each year, this conventional view obscures a fundamental reality. An 'average return' is merely a mathematical summary, not the actual market experience.
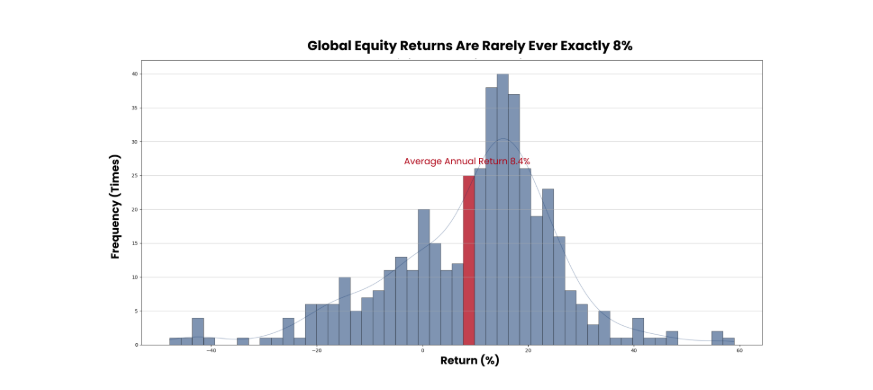
Source: Curvo (MSCI ACWI Index), Metta Associates Note: Monthly YoY Returns are calculated as the percentage change in the index value relative to the same month of the previous year (rolling 12-month basis).
The data behind the 8.4% figure reveals a highly dispersed outcome. Global markets rarely deliver a consistent 8% in any given year; instead, annual returns fluctuate across a wide spectrum. The illusion of a stable average masks the severe downturns shown on the far left of the chart, unexpected market drops of 20% to 40%.
These are not mere statistical outliers; they are destructive forces that mathematically impair the portfolio's compounding power over time. Ultimately, real-world wealth accumulation is dictated not by a single average number, but by the complex dynamics of the Sequence of Returns and Volatility of Returns.
Sequence of Returns
"Sequence of returns is not just about the total returns achieved, but the order in which gains and losses occur."
Sequence of Returns refers to the specific order of investment gains and losses over time. While most investors focus on average returns, a single average number can hide the actual experience of the investment journey.
This becomes especially important when money is being added, withdrawn, or needed by a specific date. A market decline early in retirement, for example, can be far more damaging than the same decline many years earlier, because withdrawals may force the investor to sell assets before the portfolio has time to recover.
In simple terms, two investment paths can have the same average return but lead to very different emotional and financial experiences:
- Front-loaded positive returns: Strong gains occur early, giving the portfolio a larger base from which future compounding can grow.
- Back-loaded positive returns: Weak or negative returns occur early, delaying the compounding process and making the recovery path more difficult, especially when the investor has limited time or is already withdrawing capital.
This is why wealth planning cannot rely only on average return assumptions. The timing of returns matters because real families do not invest inside a calculator. They invest across life stages, cash-flow needs, retirement dates, and moments when capital must be available.
Volatility of Returns
“Volatility of Returns is not only about daily price movements, but the wide gap between good years and bad years.”
Standard financial models often show a smooth path to wealth, assuming steady annual returns of 7%, 8%, or 9%. This may be useful for calculation, but it does not reflect the lived reality of investing. Real markets rarely move in a straight line. A portfolio may gain 30% in one year, fall 20% in another, and still appear reasonable when viewed only through its long-term average.
This is why volatility should not be understood merely as short-term market noise. For long-term wealth planning, the more important question is how widely annual returns can swing from one year to the next. Even if two portfolios share the same average return, the one with larger annual swings carries a very different risk profile.
A wider gap between gains and losses creates more uncertainty. It can make the investment journey harder to endure, weaken the reliability of compounding, and increase the risk that capital may not be available when it is needed most.
This is where the steady numbers of a financial calculator meet the uneven reality of the market. Managing volatility is not about avoiding all market movement. It is about reducing the damage that large, poorly timed losses can cause to a family’s long-term financial plan.
How the Same 8% Average Return Can Lead to Very Different Outcomes
To illustrate why the investment journey matters, a Monte Carlo simulation was used to test four different portfolio paths across thousands of potential market scenarios. Each portfolio was built around the same baseline assumption: an expected average annual return of 8%, reflecting the long-term historical average of global equities.
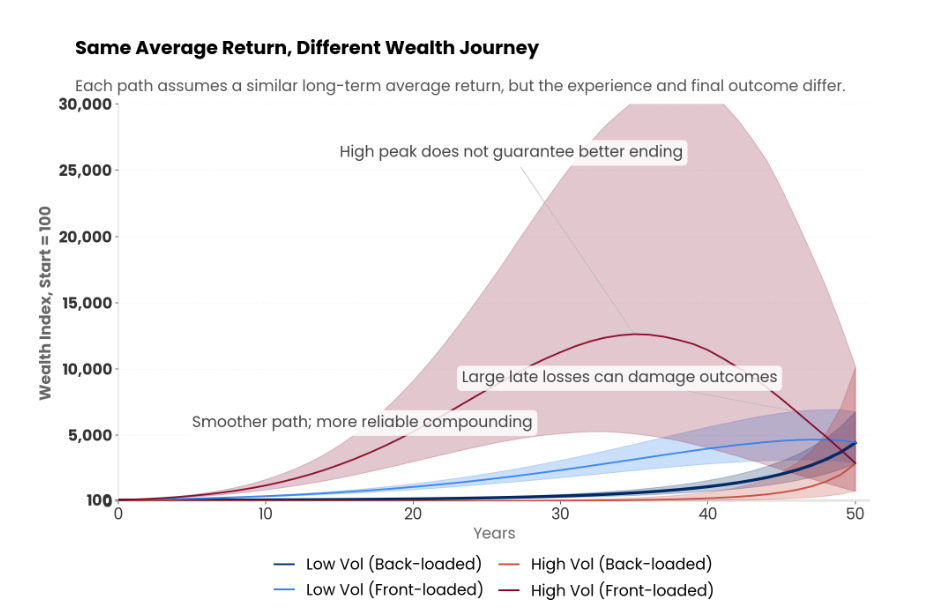
Illustrative simulation only. Each scenario assumes a 8% average annual return over 50 years. Low Vol uses 5% annual volatility; High Vol uses 15% annual volatility. Back-loaded paths sort annual returns from weakest to strongest; front-loaded paths sort annual returns from strongest to weakest. Results based on 10,000 simulations per scenario; shaded areas show illustrative 10th–90th percentile ranges, not forecasts. Prepared by Metta Associates for illustrative purposes only. Not financial advice.
Despite sharing the same target return, the outcomes varied meaningfully. The difference was not caused by a different return assumption, but by the path taken to reach that return. In some scenarios, returns arrived in a smoother pattern. In others, the portfolio experienced sharper gains, deeper losses, and more disruptive timing.
This is where the illusion of average returns becomes clear. A portfolio with high volatility may still show an attractive average return on paper, but the journey can be far more difficult in practice. Large losses can interrupt the compounding process, especially when they occur near a major financial deadline, during retirement withdrawals, or at a time when capital is needed.
The simulation therefore illustrates a simple but important lesson: long-term wealth planning cannot rely only on a single average return figure. Building durable wealth requires attention to two related risks:
- Volatility of Returns: The size and frequency of annual gains and losses. A smoother return path can support more reliable compounding and reduce the damage caused by severe drawdowns.
- Sequence of Returns: The order in which gains and losses occur. A market decline near a target date, or during a withdrawal phase, can be far more damaging than the same decline experienced earlier in the investment journey.
An effective investment strategy should therefore evolve beyond merely seeking the highest possible return. The objective is not only to grow wealth, but to improve the likelihood that wealth remains available when it is needed most.
Key Takeaways
- Average Returns Can Hide Real Investment Risk: A simple average return is only a summary. It does not show how the return was earned, how severe the losses were, or whether the portfolio remained reliable when capital was needed. Two portfolios may share the same average return, yet create very different wealth journeys.
- A Smoother Path Can Support More Reliable Compounding: Lower volatility does not mean avoiding all market movement. It means reducing the size of severe swings that can interrupt the compounding process. A smoother investment path can make long-term planning more reliable, especially for families who depend on their portfolio to support future goals, retirement income, or intergenerational wealth transfer.
- Late-Stage Drawdowns Are Especially Damaging: The timing of losses matters. A major market decline near retirement, during withdrawals, or close to a financial deadline can be more damaging than the same decline earlier in the journey. When the portfolio is larger and time to recover is shorter, a severe drawdown can create a much greater real-world impact.
- The Journey Matters as Much as the Number: The purpose of investment planning is not only to target the highest possible return. It is to improve the likelihood that wealth grows, survives difficult markets, and remains available when it is needed most.
Metta Associates's Strategic Reflection
Behind every portfolio are the years of work, discipline, and responsibility that created it. For many families, wealth is not simply a number on a statement. It represents future income, education, retirement security, family continuity, and the freedom to make important decisions with confidence.
This is why wealth planning cannot be built only around a normal average-return assumption. Markets do not move in the smooth pattern shown in a financial calculator. Returns arrive unevenly, sometimes with long periods of growth, and sometimes with difficult declines that occur at inconvenient moments. For investors approaching retirement or relying on portfolio withdrawals, the timing of those declines can matter as much as the average return itself.
At Metta Associates, we believe portfolio design should therefore focus not only on return potential, but also on the reliability of the journey. This means paying attention to volatility, sequence risk, liquidity needs, time horizon, and the emotional pressure that market downturns can create.
Our role is not to promise that uncertainty can be removed. It cannot. Our role is to help families prepare for it with structure, discipline, and care. By building portfolios that seek smoother compounding, testing plans against difficult market conditions, and ensuring capital is available when it is needed, we aim to support a more resilient path toward long-term financial security.
The objective is not merely to pursue wealth. It is to help make wealth dependable across the stages of life — always with you.
Disclaimer
The information presented is based on sources believed to be reliable; however, its accuracy or completeness cannot be guaranteed. This material does not represent a forecast and should not be interpreted as a guarantee of future outcomes. It has been prepared with care and objectivity to support long-term, planning-focused financial decisions.